Introduction
- Classification attempts to solve the problem of assigning classes to data.
- It involves allocating a class to new, unassigned cases based on existing data.
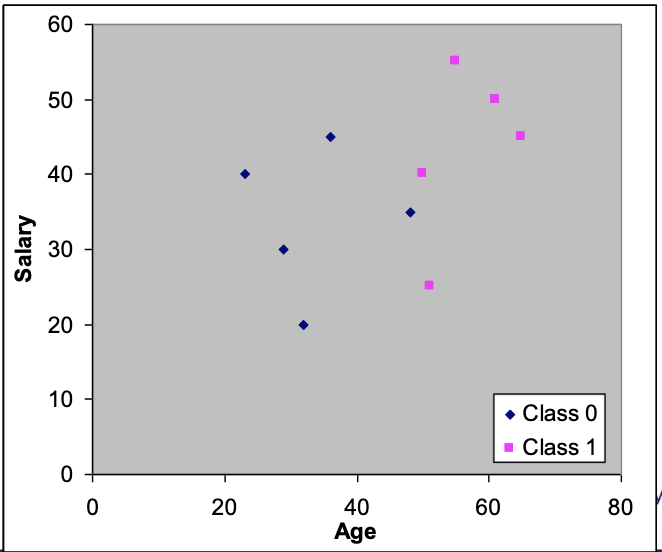
Example:
| Case | Age | Salary | Class |
|---|---|---|---|
| 1 | 50 | 40 | 1 |
| 2 | 32 | 20 | 0 |
| 3 | 36 | 45 | 0 |
| 4 | 55 | 55 | 1 |
| 5 | 61 | 50 | 0 |
| 6 | 29 | 30 | 0 |
| 7 | 48 | 35 | 0 |
| 8 | 65 | 45 | 1 |
| 9 | 23 | 40 | 0 |
| 10 | 51 | 25 | 1 |
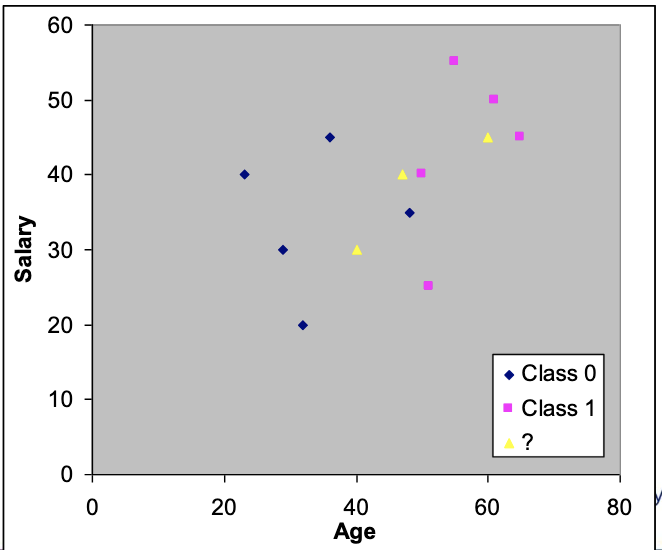
New data:
| Case | Age | Salary | Class |
|---|---|---|---|
| 11 | 60 | 45 | ? |
| 12 | 40 | 30 | ? |
| 13 | 47 | 40 | ? |
cs3002-supervised-learning-decision-trees
cs3002-supervised-learning-knearest-neighbour
Testing Performance
- Aim is to classify new unseen data.
- Often look at a simple error rate to assess our classifiers.
- error = number of errors / number of cases
- Empirical error rate is not the same as true error rate.
- Empirical is based on a sample.
- True is based on infinite cases.
- Is it possible to estimate the true error rate?
Training and Test Sets
- Obviously a good idea to split data into a training set and a test set.
- Known as the holdout method.
- Use training set to learn model.
- Use test set to score the accuracy.
- Ideally the two sets are independent (generated separately).
Resampling
- What if the sample of data is small or biased?
- Resampling methods can be used.
- Randomly select training and test sets.
- Repeat for a fixed number of iterations.
- Methods include:
- Cross-validation.
- Bootstrapping.
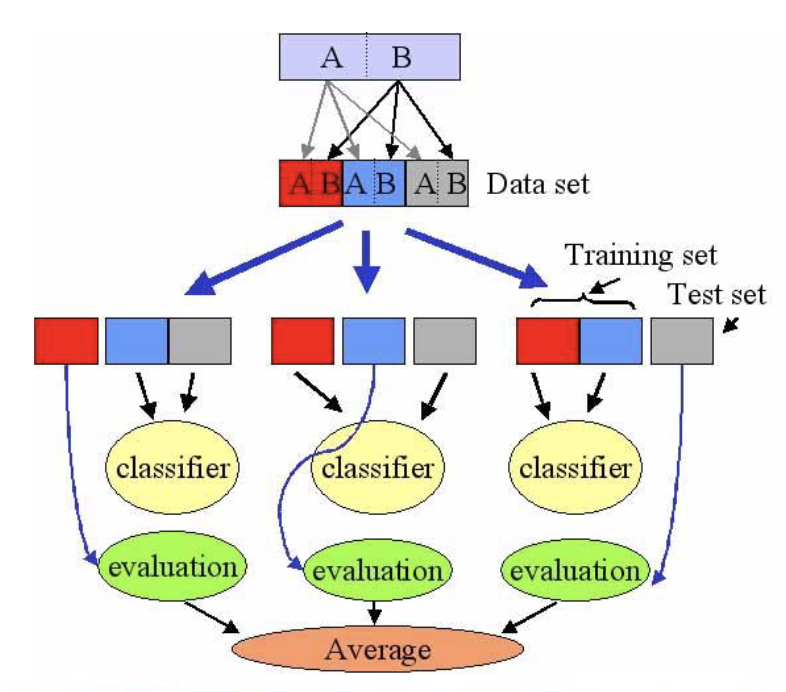
Cross-validation
- K-fold cross validation:
- Randomly split the data up into subsets of equal size.
- Remove one of the subsets and train classifier on remaining subsets.
- Test on the removed subset.
- Repeat for all subsets.
- Cross-validation is considered an unbiased estimator of true error.
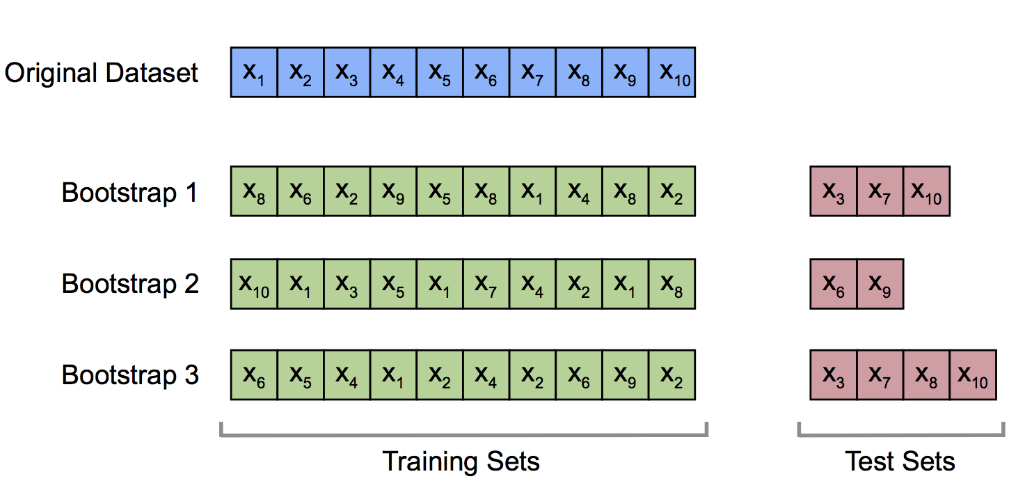
Bootstrapping
- For the bootstrap training data items are sampled with replacement from cases.
- Cases that are not found in the training set are used for the test set.
- Generally produces worse rates than the true error rate (worse case scenario).
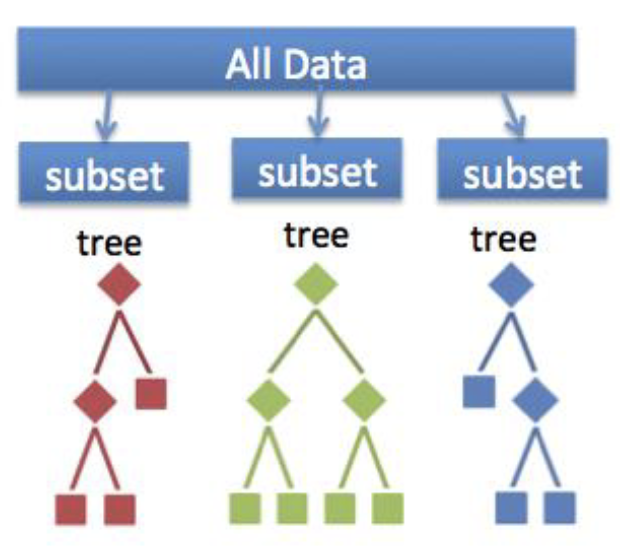
Resampling and Random Forests
cs3002-supervised-learning-confusion-matrix
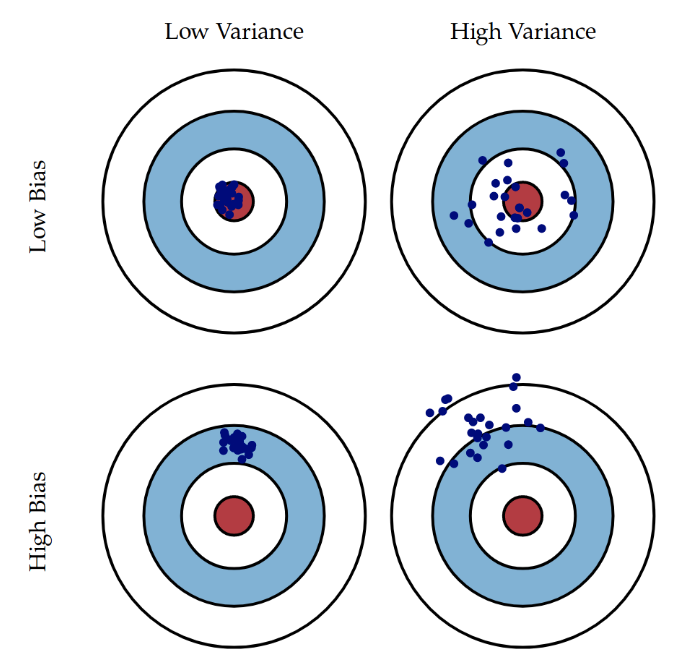
Bias, Variance and Overfitting
- Consider two models:
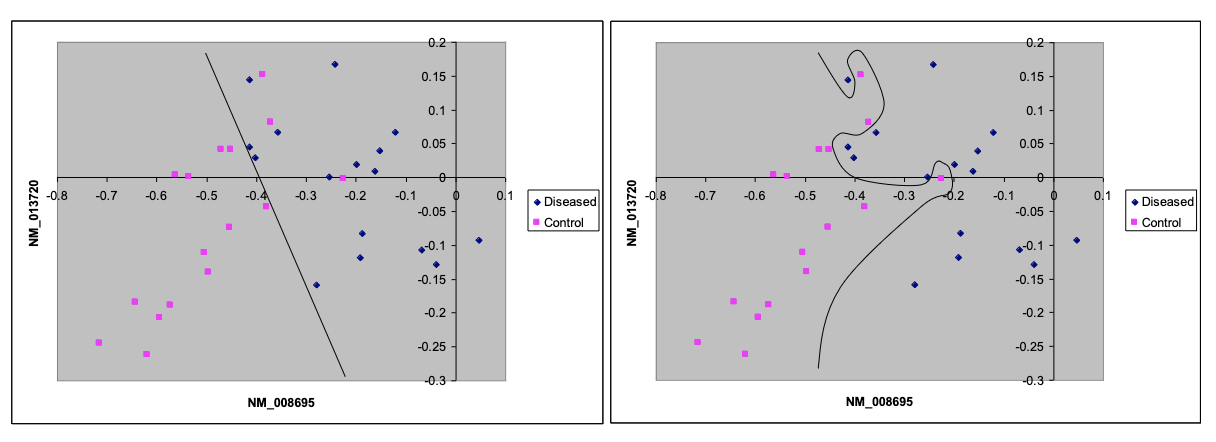
- Bias is some systematic error in the model.
- Variance is the difference from one model to the next.
- The first model (straight line) has high bias.
- The second has high variance:
- It fits the data very well.
- But it will not predict new cases.
- It has overfit to the data.
Summary
- Decision Trees
- Decision trees use a tree-like structure to make decisions and classify data.
- They are easy to interpret but can be prone to overfitting, although pruning can help mitigate this.
- K-Nearest Neighbour
- KNN is based on the proximity of data points in the feature space.
- It’s easy to interpret, but it does not model data explicitly.
- Testing Performance
- Different methods are used to assess classifier performance, such as sensitivity analysis.
- Resampling
- Resampling techniques like cross-validation and bootstrapping are employed to address issues like small or biased datasets.
- Confusion Matrix, Sensitivity and Specificity
- The confusion matrix is useful for considering the importance of errors.
- Sensitivity and specificity are common measures for evaluating classifier performance.
- confuPrecision and Recall
- Precision and recall are particularly relevant for imbalanced data, where one class is much larger than the other.
- ROC Curves vs. PR Curves
- ROC curves illustrate the tradeoff between sensitivity and specificity.
- PR curves illustrate the tradeoff between precision and recall.
- Bias, Variance, and Overfitting
- Models can exhibit bias (systematic errors) or high variance (overfitting).
- Overfit models may perform well on training data but poorly on new data.