Overview
It results in a series of clustering results.
Starts with each object in its cluster and it ends with all objects in the same cluster, with the intermediate clusters being created by a series of merges.
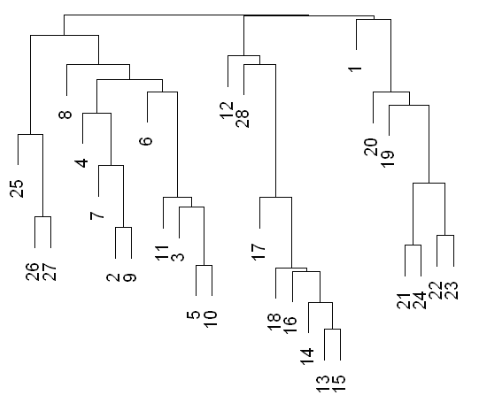
Dendrogram Explanation
The resultant tree is called a dendrogram:
Algorithm Overview
- Each item is assigned to its own cluster (n clusters of size one).
- Let the distances between the clusters equal the distances between the objects they contain.
- Find the closest pair of clusters and merge them into a single cluster (one less cluster).
- Re-compute the distances between the new cluster and each of the old clusters.
- Repeat steps 3 and 4 until there is only one cluster left.
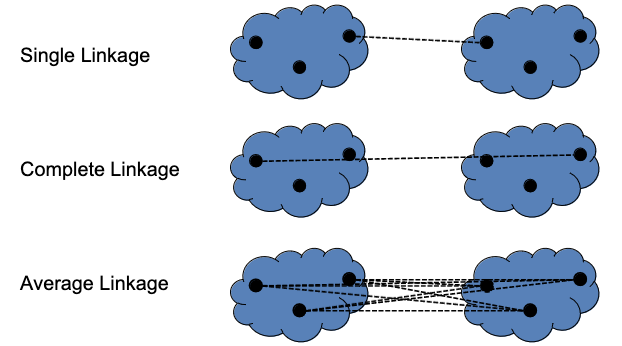
Re-computing Distances (Single, Complete, Average Linkage)
| Link | Description |
|---|---|
| Single | Smallest distance between any two pairs from the two clusters (one from each) being compared/measured. |
| Average | Average distance between pairs. |
| Complete | Largest distance between any two pairs from the two clusters (one from each) being compared/measured. |
Other methods:
- Ward.
- McQuitty.
- Median.
- Centroid.
Can find a demo here.
Pros and Cons
Pros:
- Can produce an ordering of the objects, might be informative for data display.
- Smaller clusters are generated, might be helpful for discovery.
Cons:
- No provision for a relocation of objects that may have been ‘incorrectly’ grouped at an early stage.
- Different distance metrics for measuring distances between clusters may generate different results.