Introduction
In unsupervised learning, no labels are provided.
- Algorithm detects structure in unlabelled input data.
There are two types:
- Clustering: goal is to find homogeneous subgroups within the data (based on the distance between observations).
- Dimensionality reduction: goal is to identify pattens in the features of the data. Often used to visualise data as well as pre-process it.
K-means clustering
Partitions observations into a fixed number of clusters. It finds homogeneous clusters.
stats::kmeans(x, centers=3, nstart=10)where
xis a numeric data matrix.centersis a pre-defined number of clusters.- k-means has a random component and can be repeated
nstarttimes to improve the model.
# initialisation: random assign class membership
set.seed(12)
init <- sample(3, nrow(x), replace=TRUE)
plot(x, col=init)

# iteration
# 1. calc the center of each subgroup as the avg pos of
#    all observations in that subgroup.
# 2. each observation is then assigned to the group of
#    its nearest centre.

# layout for plotting: 1 row and 2 columns of plots
par(mfrow=c(1,2))
# use colors specified by init
plot(x, col=init)
# calc cluster centres by taking the mean of each cluter's points
centres <- sapply(1:3, function(i) colMeans(x[init == i, ], ))
# transpose for plotting
centres <- t(centres)
# plot as points
points(centres[, 1], centres[, 2], pch=19, col=1:3)

# calc distance between cluster centers and data points
tmp <- dist(rbind(centres, x))
# convert distance matrix to data frame and keep only the first
# 3 columns
tmp <- as.matrix(tmp)[, 1:3]

# assign clusters for each data point by finding closest cluster
# center
ki <- apply(tmp, 1, which.min)
# remove the first 3 rows (distances to cluster centers)
ki <- ki[-(1:3)]

plot(x, col=ki)
points(centres[, 1], centres[, 2], pch=19, col=1:3)
Model Selection
The best outcome: smallest total within cluster sum of squares (SS). It is calculated as:
For each cluster results:
- for each observation, determine the squared euclidean distance from observation to centre of cluster.
- sum all distances.
This is a local minimum, no guarantee of a global minimum.
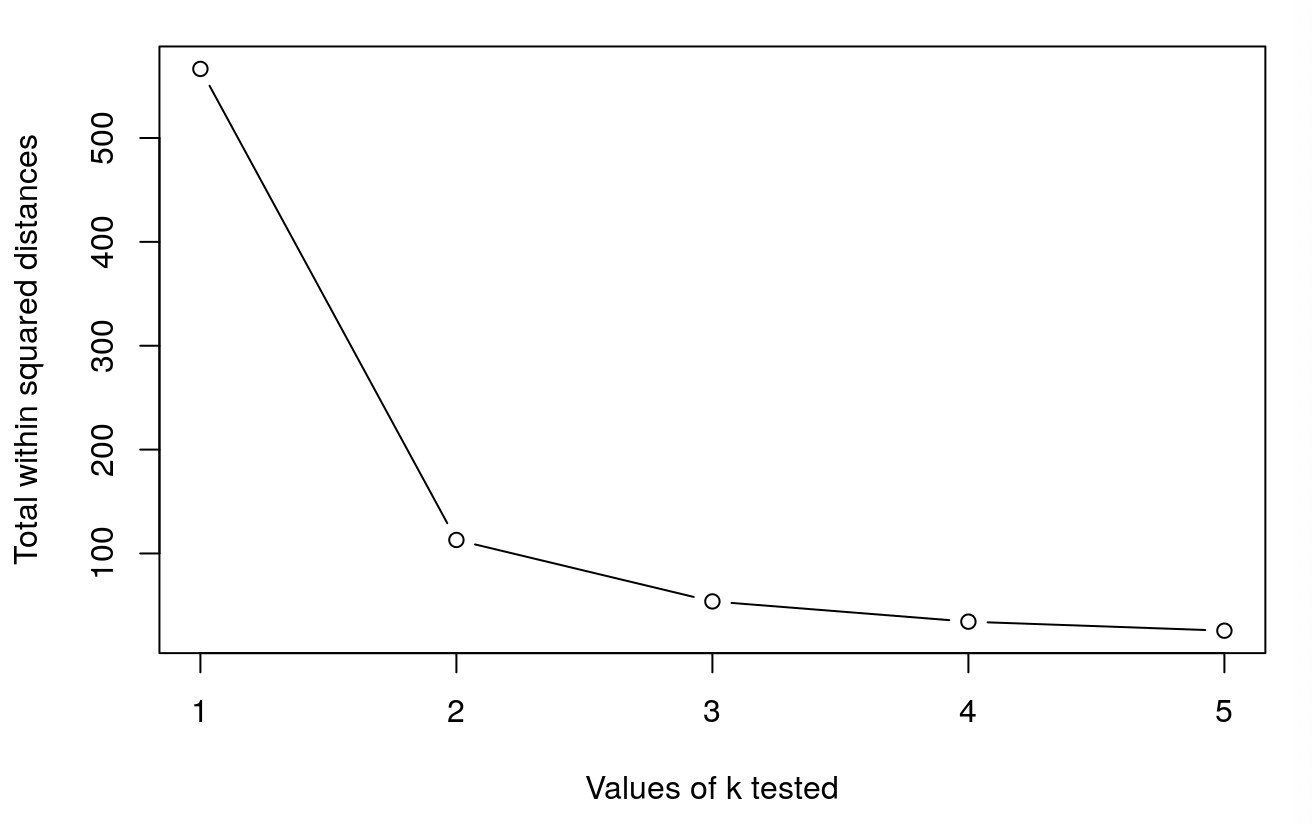
How to determine the number of clusters
- Run k-means with
k=1,k=2, …,k=n - Record total within SS for each value of k.
- Choose k at the elbow position, as illustrated below.